
Evaluating a microbial preparation for poultry coccidiosis management requires three distinct questions: has parasite output changed, has intestinal injury decreased, and have production losses improved? Oocysts per gram of excreta (OPG), lesion scores and feed conversion ratio (FCR) describe different endpoints. A credible field assessment aligns bird age, management background, observation period and independent housing units before connecting biological effects to cost. This article uses published experiments to explain interpretation and proposes a framework for naturally exposed flocks. The proposed design and illustrative calculation are not completed company field results.[1, 3, 5]
Define the improvement that the study must demonstrate
OPG describes parasite shedding at the time of sampling; lesion scores describe gross injury in a specified intestinal region; FCR relates feed input to weight gain. Lower OPG, lower lesion scores and lower FCR can each be useful outcomes, but the claim must match the measurement. Improved weight gain supports a production claim and does not, by itself, demonstrate suppression of coccidia.[1, 2, 3]
A meta-analysis by Hauck and colleagues included 38 experiments from 37 papers. Untreated-to-treated ratios for lesion scores or shedding were not significantly correlated with ratios for final body weight. This does not make either endpoint uninformative. It shows why one measurement should not be treated as a reliable substitute for another. A formal evaluation should identify a primary endpoint and use the remaining measurements to explain the result.[1]
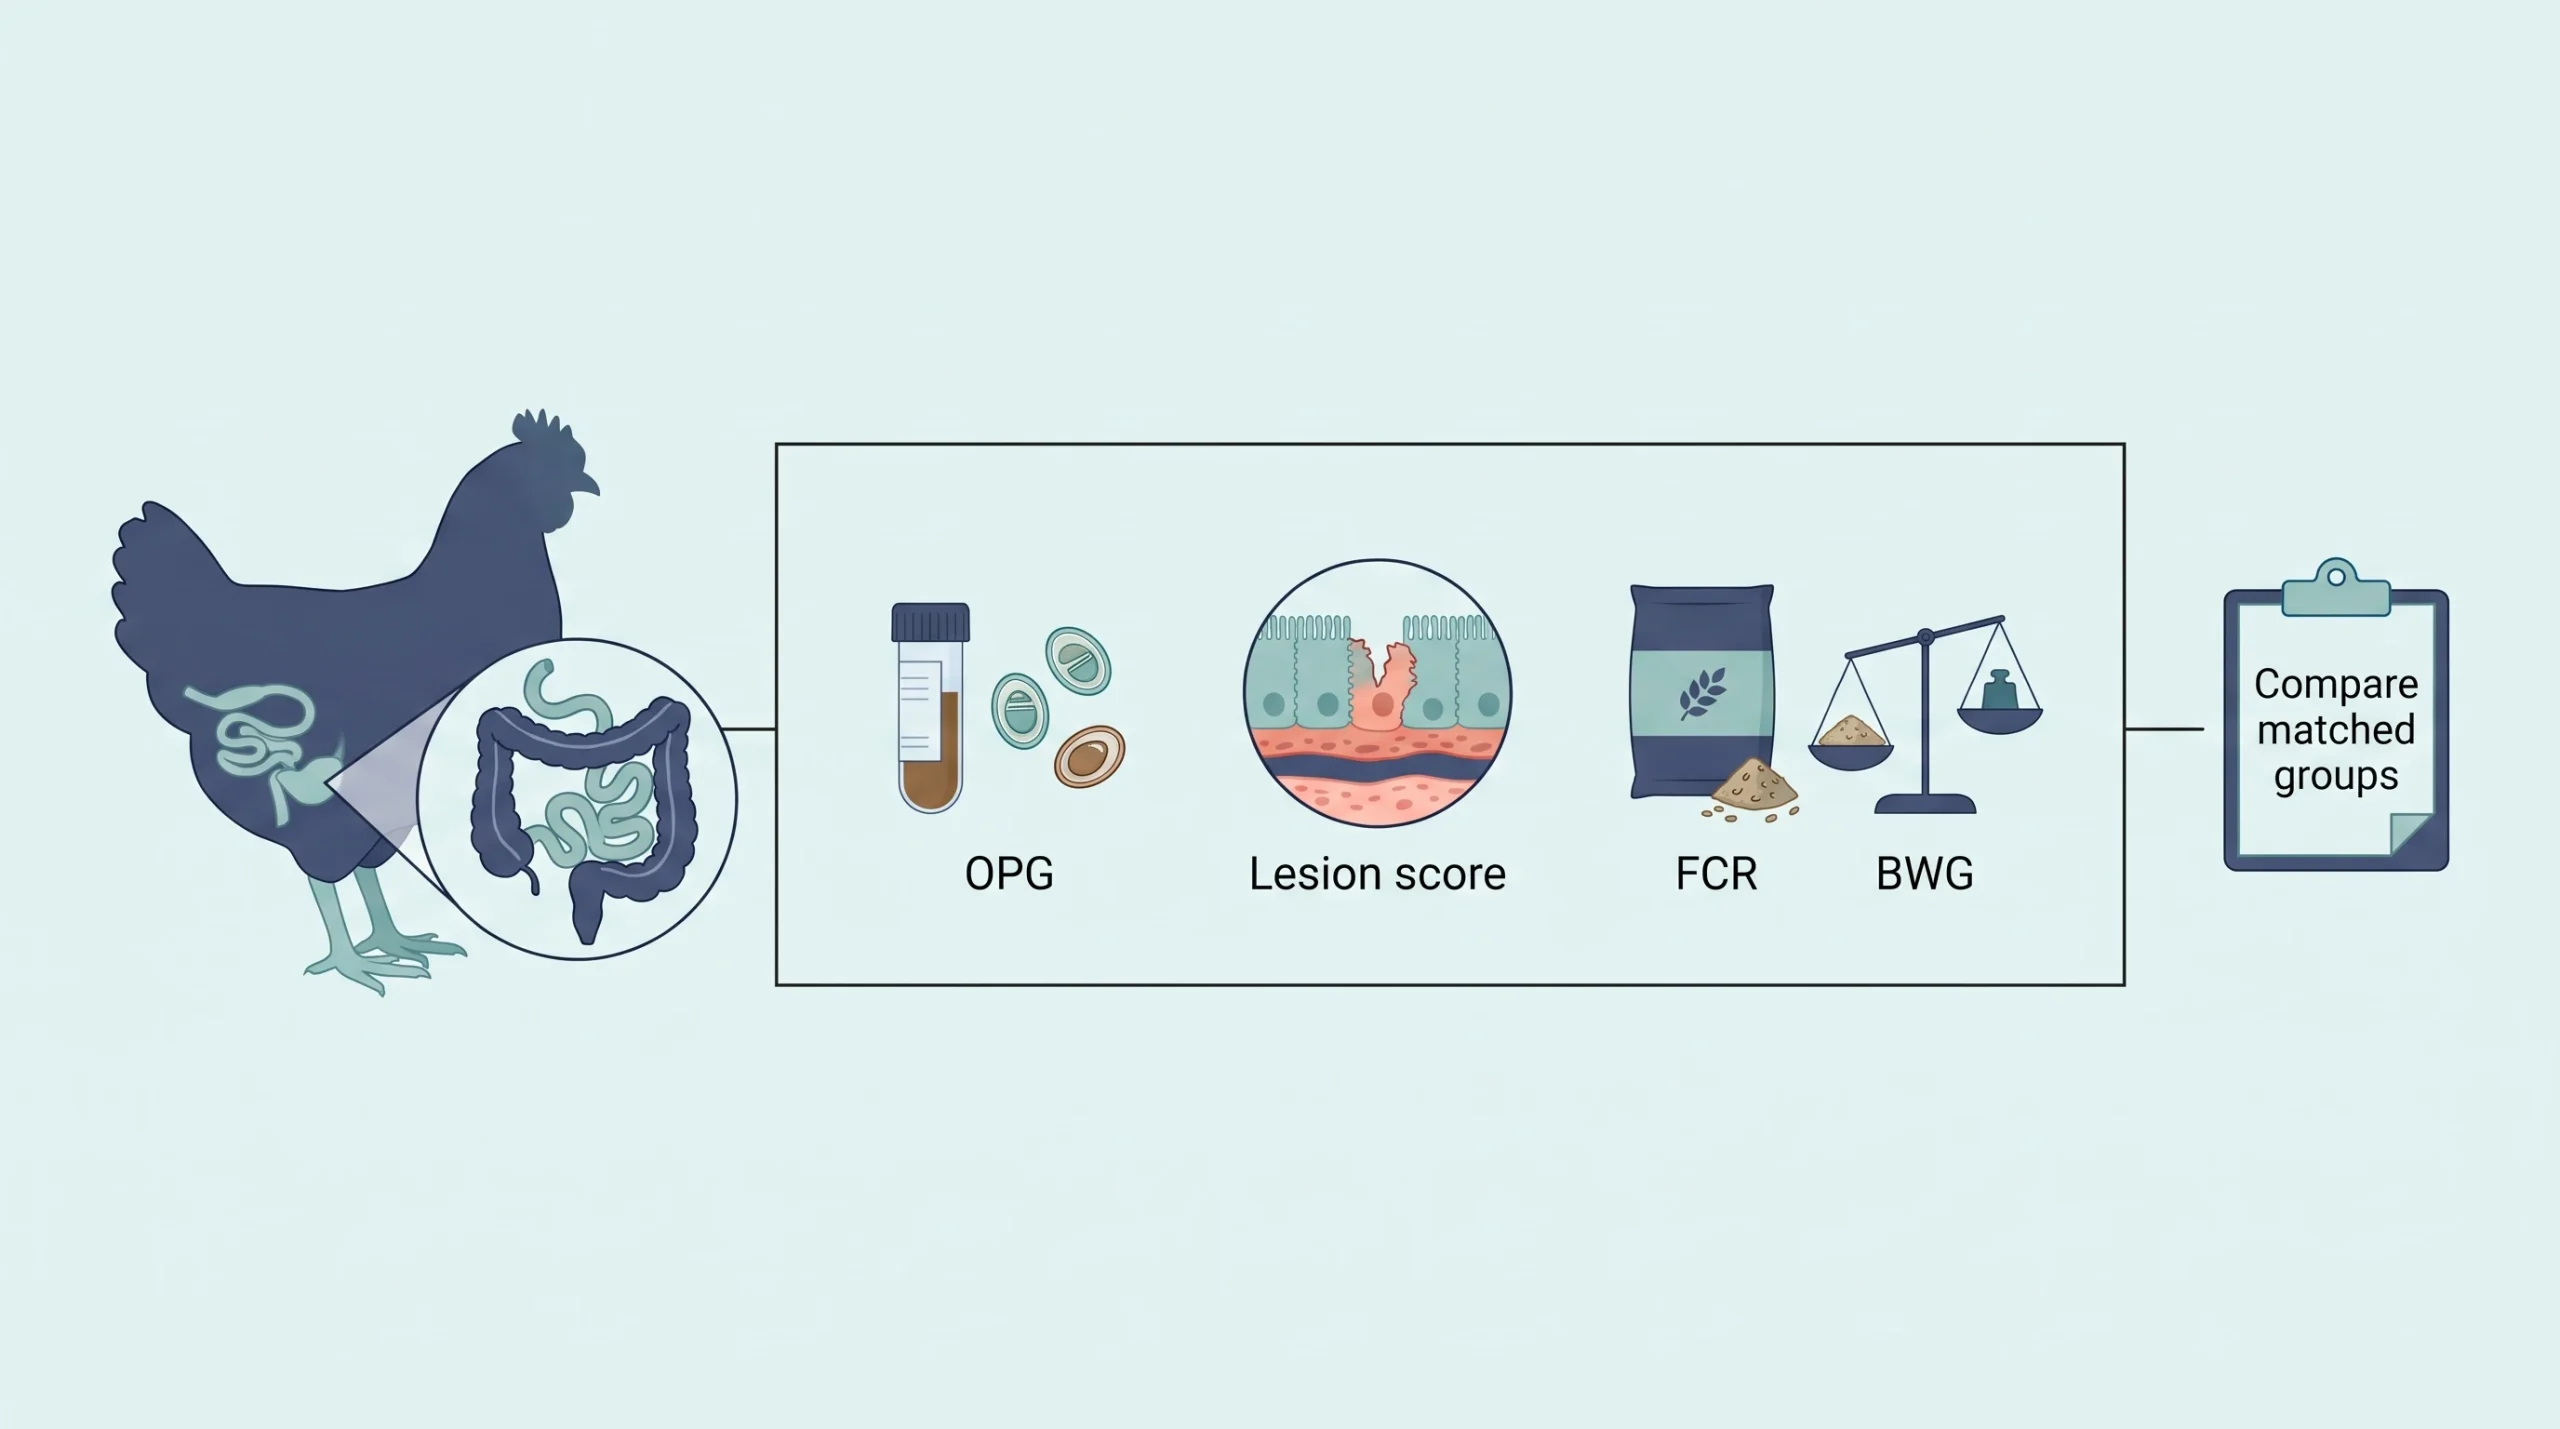
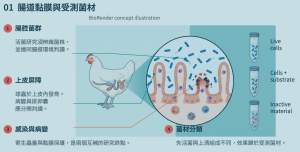
Evaluation concept created with BioRender, not measured mechanisms or experimental results. OPG describes shedding, lesion scores describe injury, and FCR and BWG describe feed efficiency and gain. Connecting lines do not establish causation. Sample size, quantitative axes and statistical tests are not applicable.
Table 1 Questions answered by each endpoint
| Endpoint | Question addressed | Required comparison context |
|---|---|---|
| OPG | Oocyst shedding per gram at sampling | Sampling basis, timing, detection limit, raw and log counts |
| Regional lesions | Injury in a specified intestinal segment | Site, scale, blinded scoring, bird and pen sample sizes |
| FCR and weight gain | Feed efficiency and growth over a defined period | Feed, gain, mortality adjustment and independent units |
| Mortality and cost | Health losses and realized economic value | Denominator, period, cause, prices and incremental costs |
Align units and observation periods before comparing OPG and lesions
Retain sampling date, bird age, sample origin, fresh-weight or other mass basis, laboratory method and detection limit with every OPG result. Identify the pen represented by a pooled sample. Recounting that sample creates technical replicates, not additional independent flocks. A result below detection does not establish absence of infection, and variation in fecal water content can affect concentration per gram. Keep raw and log10-transformed counts in separate fields. Do not calculate percentage shedding reduction directly from logarithmic values; document how zeros were handled.
Lesion assessment requires a consistent intestinal site, scoring system and trained assessor, preferably with blinded scoring by a veterinarian or qualified team. The Johnson–Reid system and subsequent studies use a zero-to-four scale, but summed, averaged and site-specific scores are different variables.[2, 5] Across three broiler experiments, Bortoluzzi and colleagues found species-dependent temporal patterns of lesion development. Comparing groups at different observation points can therefore mistake timing for efficacy.[3]
In the 42-day experiment by Javanmiri and colleagues, whole-period FCR was 2.06 for the probiotic, 2.26 for the composite synbiotic and 1.95 for the infected control. Corresponding mean log10 OPG values were 4.41, 4.23 and 4.28. The synbiotic had significantly poorer FCR without significantly different OPG from the infected control. Because this preparation also contained multiple enzymes, the result cannot be attributed to an individual strain or generalized to all synbiotics. Figure 2 retains all groups and the reported statistical letters.[4]
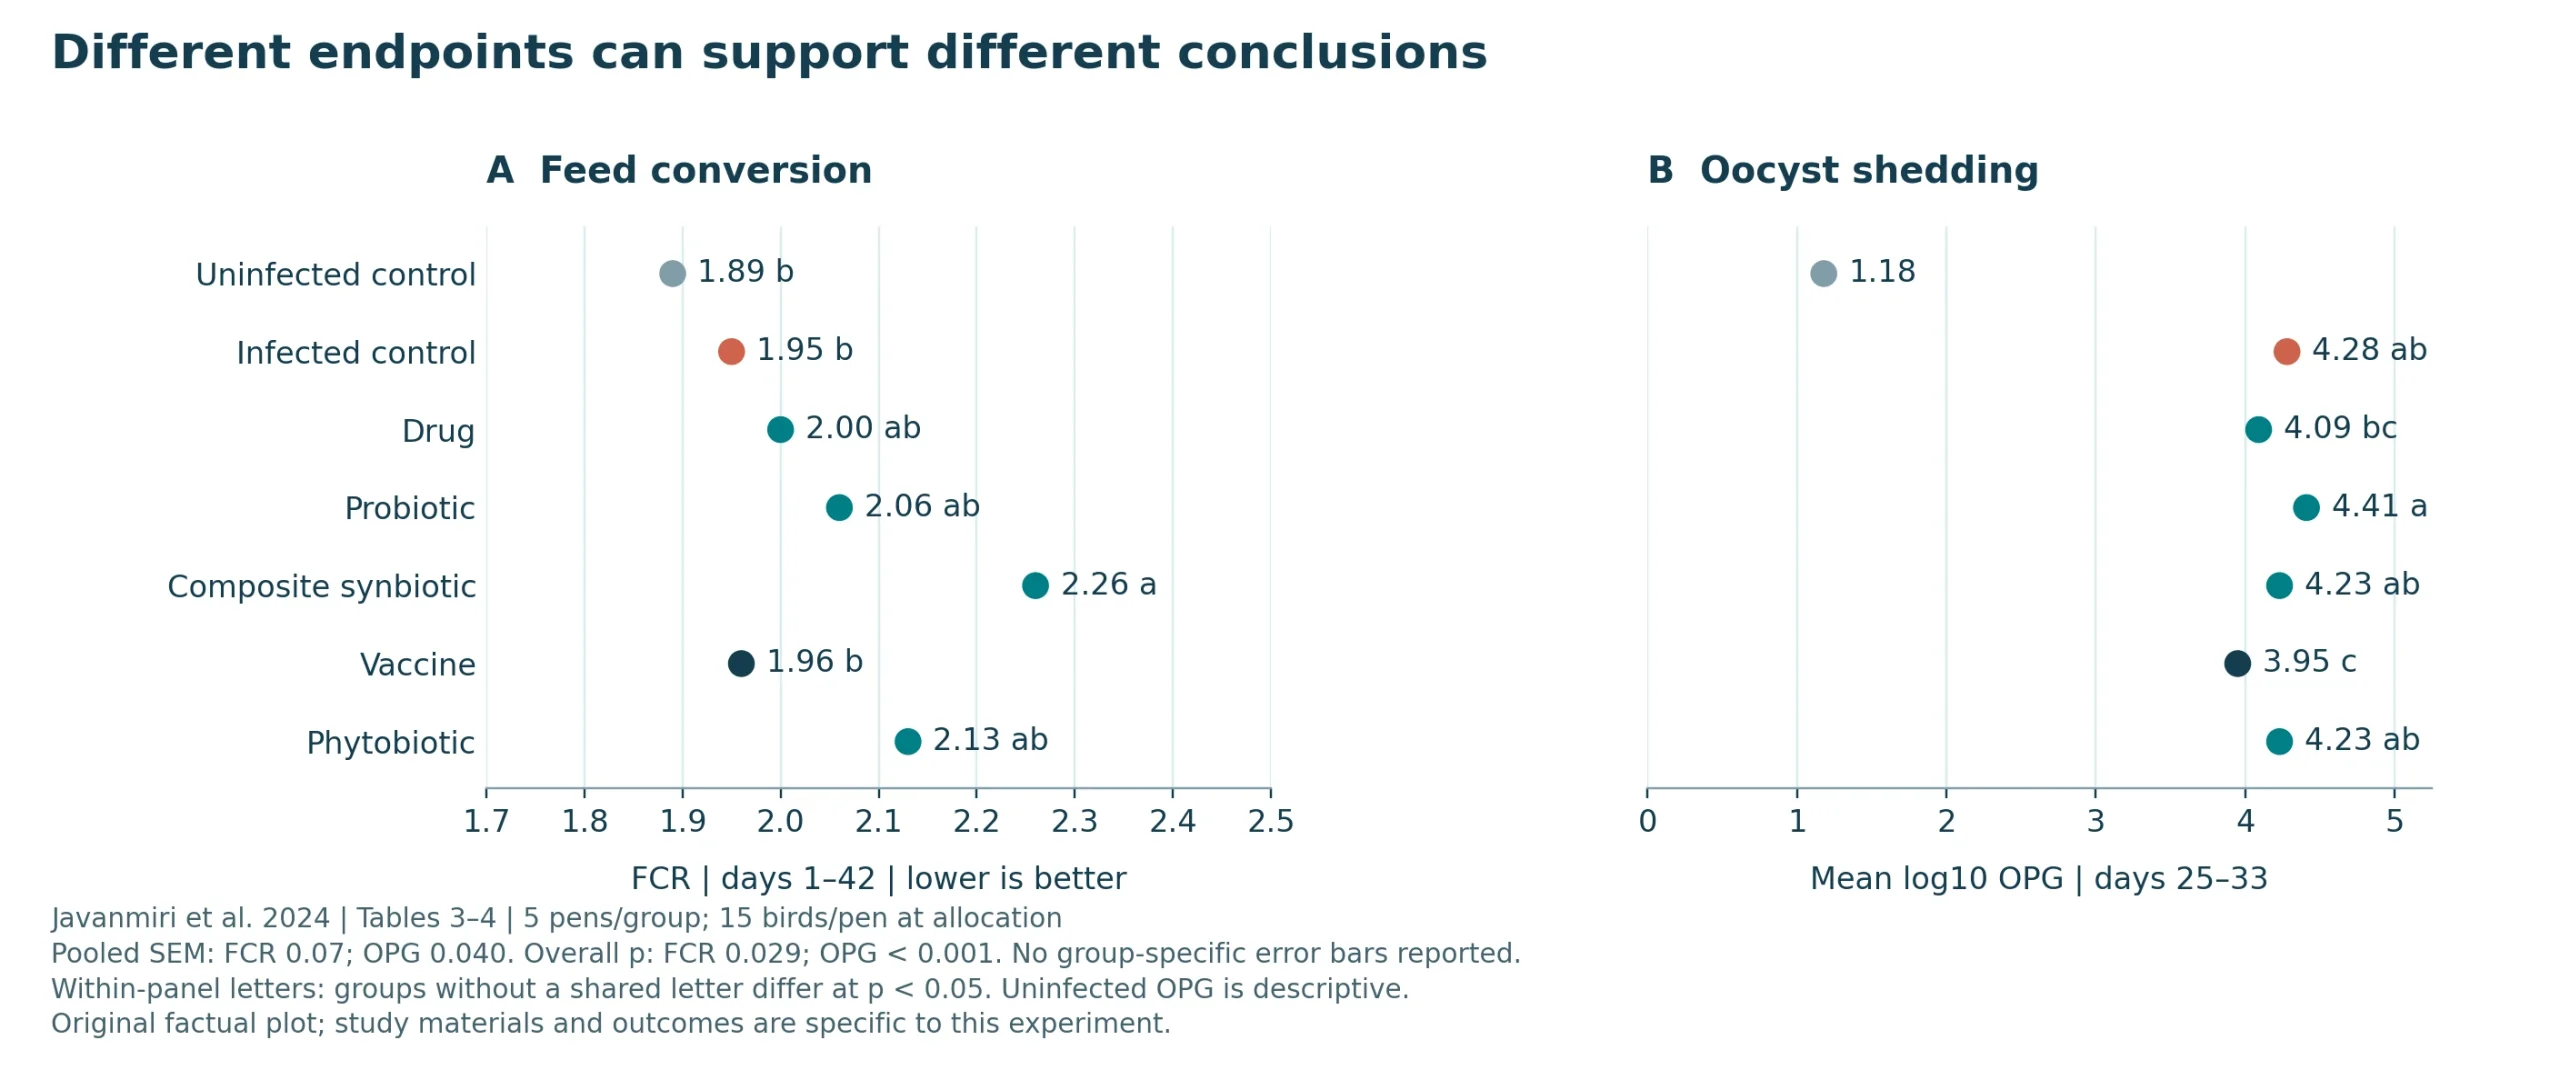
Independent factual plots of Javanmiri et al. (2024), Tables 3–4. Five pens/group, initially 15 birds/pen. FCR covers days 1–42; OPG covers days 25–33. Pooled SEM: 0.07 and 0.040; overall p: 0.029 and <0.001. Within-panel groups without shared letters differ at p<0.05; uninfected OPG is descriptive. Group-specific uncertainty was not available and is not fabricated. Shared letters do not establish equivalence; the enzyme-containing composite synbiotic had poorer FCR. The day-42 table has interpretive inconsistency between its omnibus p and lettering and is not used for inference.[4]
Read ACI alongside its component measurements
The anticoccidial index, ACI, commonly adds relative weight gain expressed as a percentage and survival rate, then subtracts lesion and oocyst indices. Verify the reference group, conversion scales and assessment period for every component. Missing components cannot be reconstructed from OPG or mortality alone. Study-specific classification thresholds should not automatically become product acceptance criteria for commercial farms.
The pilot study by Rodriguez and colleagues illustrates the issue. Animal welfare practices combined with an organic fermented additive produced ACI values of 145.4 and 180.6 at the earlier and later assessments; welfare practices alone produced 177.9 and 173.9. The combined group’s oocyst index fell from 40 to 10, yet its later lesion index was 11.00, compared with 10.10 under welfare practices alone. A higher composite score did not mean every component was better. Relative weight gain used the untreated infected group as its denominator. Replacing that denominator with an uninfected control would invalidate direct use of the published ACI. The table provides neither uncertainty estimates nor pairwise testing for these ACI values, so Figure 3 adds no significance markers.[5]
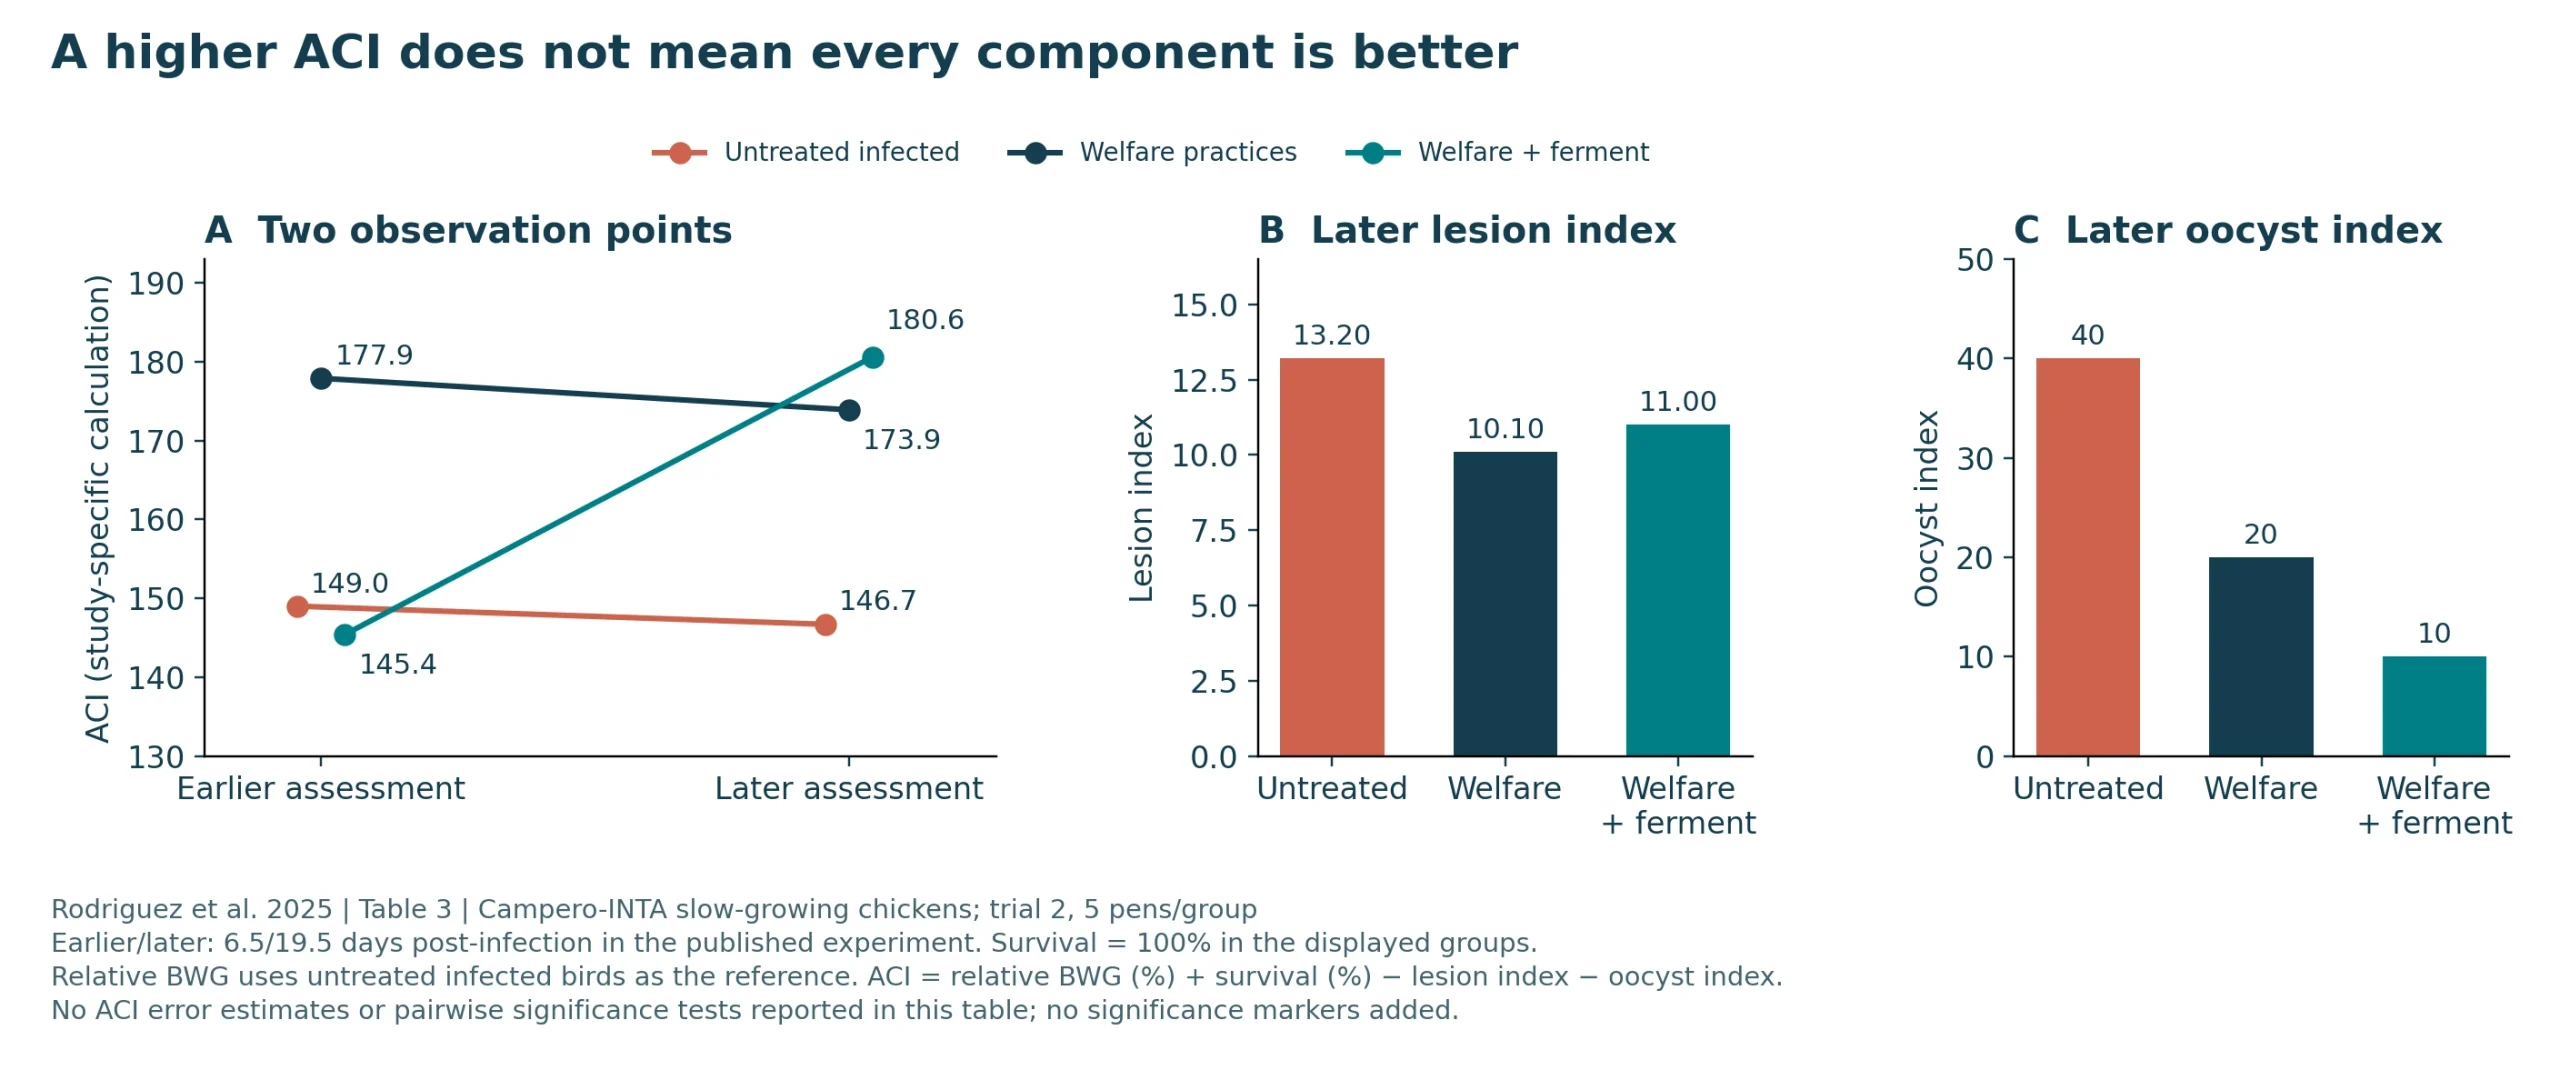
Redrawn from Rodriguez et al. (2025), Table 3, under CC BY 4.0; five replicate pens/group. Earlier/later refer to 6.5/19.5 days post-infection in the source experiment, not a field sampling prescription. All displayed groups had 100% survival; relative gain uses the untreated infected group. ACI uncertainty and pairwise tests were not reported. Higher later ACI in the combined group coexisted with a lesion index above that of welfare practices alone.[5]
Separate the contribution of management from the combined intervention
At 75 days in the same pilot, feed conversion was 2.80 for the untreated infected group, 2.51 for welfare practices alone and 2.40 for welfare practices plus the fermented additive. Figure 4 also shows weight gain and the reported standard deviations. The incremental contribution under that management background should first be assessed against welfare practices alone. The entire difference from the untreated group cannot be assigned to the additive. Five replicate pens per group provide the independent feed-data units.[5]
The experiment used mixed-sex Campero-INTA slow-growing chickens over a 75-day production cycle. This controlled pilot cannot directly quantify returns in Taiwanese commercial fast-growing broilers. Its mixed fermentation material should not be relabeled as a specific strain or a defined postbiotic. Vaccination is another essential background variable: a live coccidiosis vaccine study reported shedding separately after vaccination and after subsequent exposure. Lower shedding throughout every phase should not be assumed to represent a single shared objective.[5, 6]
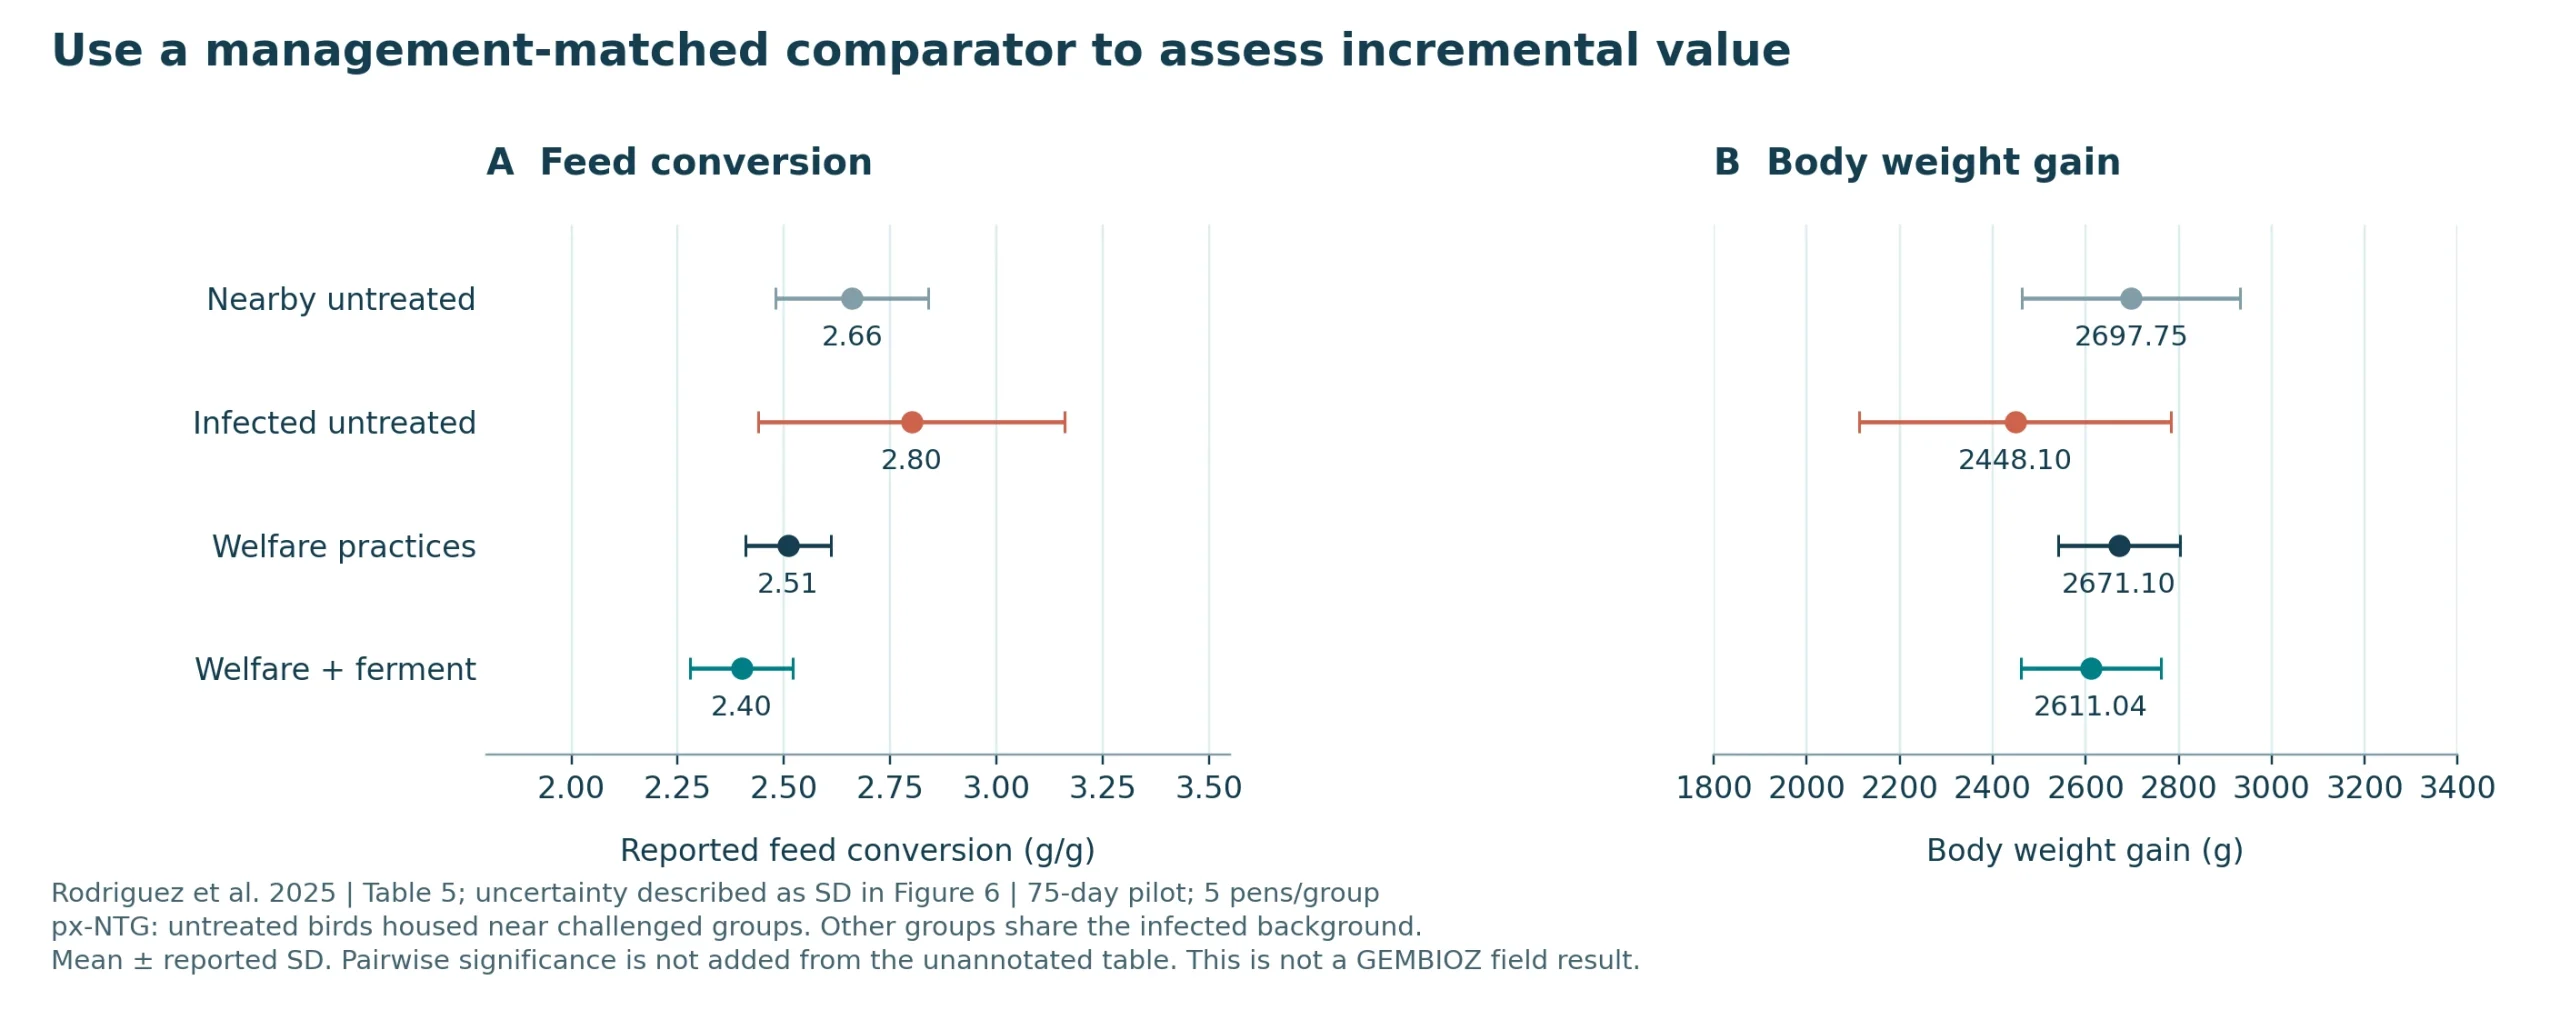
Redrawn from Rodriguez et al. (2025), Table 5; error bars follow the SD definition in original Figure 6, with five replicate pens/group. px-NTG denotes untreated birds housed near the challenged groups and is distinct from the untreated infected group. The combined-versus-welfare comparison is the relevant incremental comparison; the entire difference from untreated birds cannot be assigned to the additive. Pairwise significance and equivalence are not inferred from the unannotated table.[5]
Build a comparable evaluation in naturally exposed commercial flocks
A practical starting point is a prospective concurrent comparison in naturally exposed flocks while maintaining veterinary control measures. Do not create infection for field validation. Match independently managed pens, houses or batches for bird source, age, sex, diet, stocking density and vaccine or medication background, and randomize allocation where feasible. If feed or water is shared across an entire house, the house is the treatment unit; individual birds within it are not independent treatment replicates.
Specify one primary endpoint before starting, such as pen FCR over a fixed period. Record OPG trajectories, regional lesions, weight gain and mortality or culling as secondary outcomes. Use consistent baseline and follow-up sampling rules, with veterinary assessment scheduled to suit flock conditions. Provide rescue treatment when needed and record its timing and reason. Determine sample size from between-unit variability and a predefined minimum important difference. A one-house versus one-house comparison is exploratory and cannot establish reproducible efficacy.
Aggregate results at the independent unit and account for clustering and repeated observations. Report between-group differences, confidence intervals and missing data. State how feed use, starting and ending weight, transfers and mortality or culling weights enter FCR. Sequential batches can support management monitoring, but season, bird source and infection pressure constrain causal inference. Improvement after adoption alone does not demonstrate a product effect.
Table 2 Records for naturally exposed field validation
| Stage | Prespecified records | Purpose |
|---|---|---|
| Before starting | Primary endpoint, comparison unit, material batch and shared management | Avoid selecting favorable endpoints after observing results |
| During follow-up | Consistent OPG, veterinary lesion assessment, feed, weight, losses and rescue care | Connect shedding, injury and production |
| At closeout | Unit-level differences, confidence intervals, missingness, matched-denominator cost and sensitivity | Assess magnitude, credibility and value of further validation |
Link cost only to effects that have been established
Use a consistent denominator. On a kilogram-of-weight-gain basis, the difference in FCR multiplied by feed price estimates the feed-cost difference; subtract incremental program cost on the same basis. In a hypothetical example, an FCR improvement of 0.03 at a feed price of TWD 12/kg gives TWD 0.36/kg gain. An incremental program cost of TWD 0.12/kg gain leaves TWD 0.24/kg gain from these two components alone. These are illustrative assumptions, not experimental results or a GEMBIOZ return claim.
A farm-level assessment must also include saleable weight, revenue, mortality, testing, labor and other interventions without double counting. Mortality-adjusted FCR is not cost per kilogram of saleable live weight. For a full margin calculation using saleable output, use actual revenue and total costs. Global cost research provides economic context but does not replace farm-specific prices and risks.[7] Conclusions should identify which of the parasite, tissue and production domains is supported before deciding whether to expand validation.
References
[1] Hauck R, Eckert J, Hunter C (2022). Meta-Analysis of the Use of Eimeria Lesion Scores and Oocyst Counts in Floor-Pen Studies. Avian diseases 66(4):381-388. doi:10.1637/aviandiseases-d-22-00039
[2] Johnson J, Reid WM (1970). Anticoccidial drugs: lesion scoring techniques in battery and floor-pen experiments with chickens. Experimental parasitology 28(1):30-36. doi:10.1016/0014-4894(70)90063-9
[3] Bortoluzzi C, Phillips CA, Cowieson AJ, Ramirez SM, Lumpkins B, Mathis G (2025). Coccidiosis in chickens: From temporal patterns of Lesion development and Oocyst shedding to predictive modeling. Poultry science 104(11):105750. doi:10.1016/j.psj.2025.105750
[4] Javanmiri E, Rahimi S, Karimi Torshizi MA, Nabiyan S, Behnamifar A, Grimes J (2024). Comparison of the effect of anticoccidial drug, probiotic, synbiotic, phytochemicals and vaccine in prevention and control of coccidiosis in broiler chickens challenged with Eimeria spp. Poultry science 103(12):104357. doi:10.1016/j.psj.2024.104357
[5] Rodriguez AE, Britez JD, Pisón-Martínez ML, Delgado FO, Balbiani F, Berardo CC, Gramaglia C, Cuba F, Poklepovich TJ, Moreno C, Francinelli G, Morici G, Arias M, Schapiro J, Barbano P, Tomazic ML (2025). Evaluating Good Husbandry Practices and Organic Fermented Additives for Coccidiosis Control in a Pilot Study Using Slow-Growing Broilers. Animals : an open access journal from MDPI 15(12):1752. doi:10.3390/ani15121752
[6] El-Shall NA, El-Naggar K, El-Kasrawy NI, Elblehi SS, Albadrani GM, Al-Ghadi MQ, Abdel-Daim MM (2024). The anticoccidial effects of probiotics and prebiotics on the live coccidia vaccine and the subsequent influence on poultry performance post-challenge with mixed Eimeria species. Poultry science 103(12):104283. doi:10.1016/j.psj.2024.104283
[7] Blake DP, Knox J, Dehaeck B, Huntington B, Rathinam T, Ravipati V, Ayoade S, Gilbert W, Adebambo AO, Jatau ID, Raman M, Parker D, Rushton J, Tomley FM (2020). Re-calculating the cost of coccidiosis in chickens. Veterinary research 51(1):115. doi:10.1186/s13567-020-00837-2
Proposed field-validation framework; not a completed company trial. Context photos, conceptual illustrations and measured research results are identified separately.