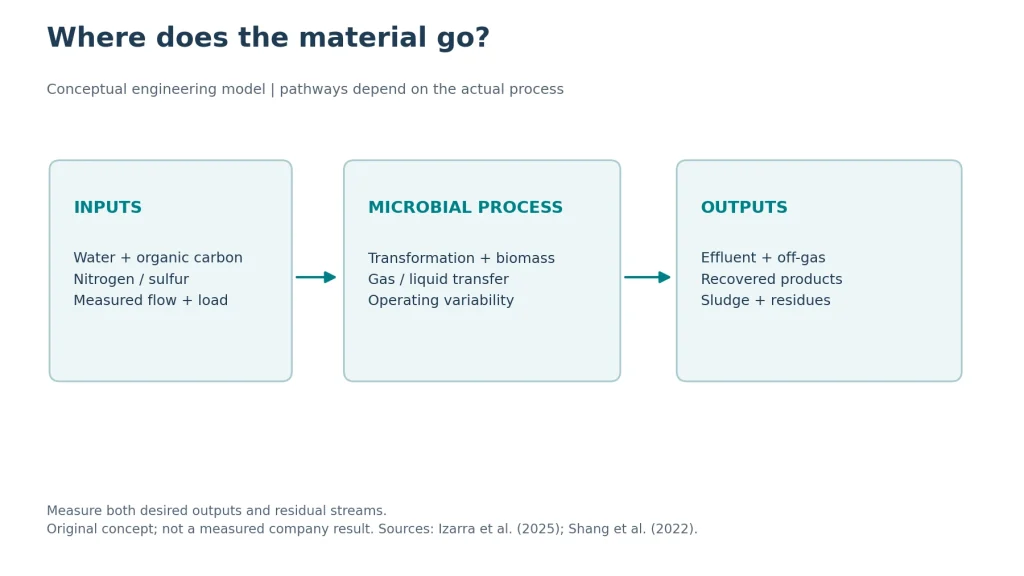

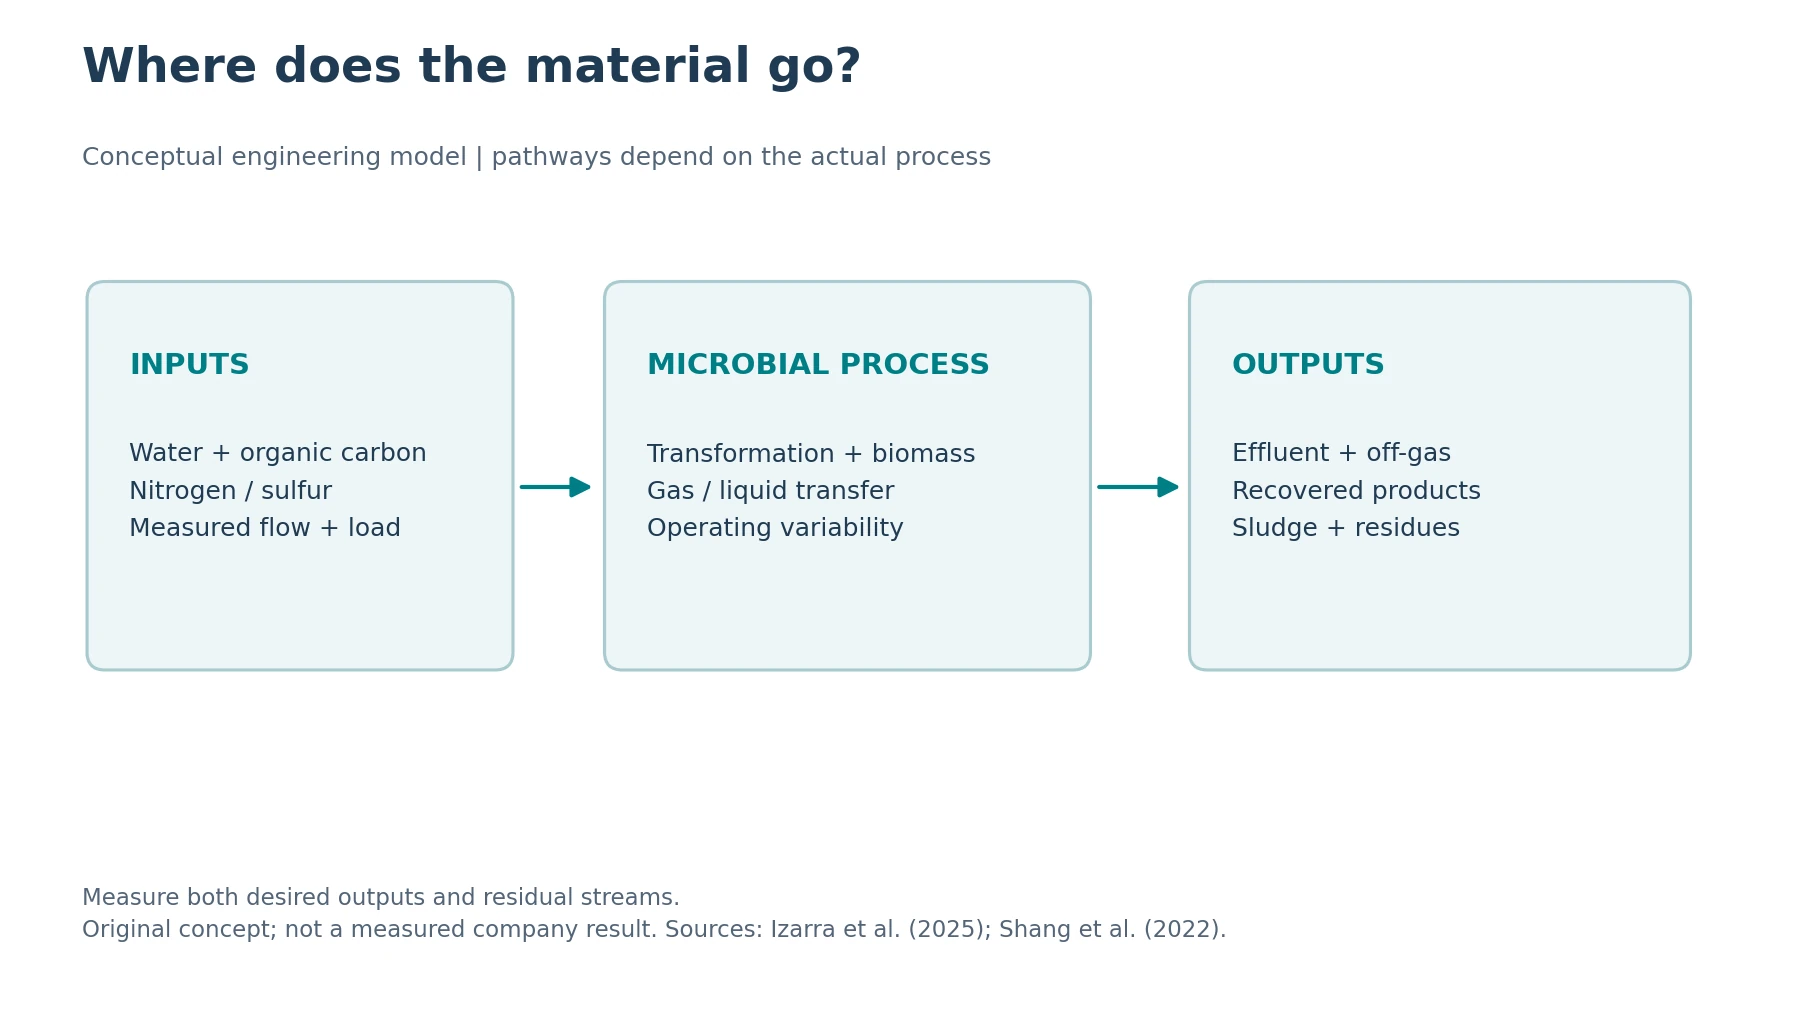
Industrial microbiomes create value when they sustain measurable transformations under real feedstocks and changing loads. Organic carbon may be degraded, incorporated into biomass or converted into recoverable products; odorous compounds may be absorbed and biologically transformed. Lower pollutant concentrations, greater resource recovery and a smaller overall environmental burden are separate outcomes. An assessment should track material destinations, operating stability and treatment cost per unit, rather than relying on microbial counts or a single removal percentage.
Define the problem before selecting a microbial solution
Activated sludge is already a microbial community process. Industrial applications differ in influent composition, target compounds and reactor conditions. Biodegradable organics, nitrogen, sulfur-containing gases and recoverable carbon require different functions and measurements. Discoloration, precipitation or reduced smell in a flask still requires an explanation: chemical transformation, adsorption, dilution or transfer into sludge and off-gas can produce superficially similar observations.
Start by defining the boundary: the whole wastewater stream, a sidestream or collected exhaust gas. Combine concentrations with flow to determine daily pollutant loads. Lower production or dilution can reduce outlet concentrations without improving biological treatment. Establishing these distinctions gives subsequent community analysis and functional measurements an engineering context.
Waste carbon to biopolymers: evidence at demonstration scale
Izarra and colleagues used organic acids derived from municipal solid waste to support short-chain-length polyhydroxyalkanoate, or scl-PHA, accumulation by mixed microbial cultures. Their 2025 demonstration involved a 20 m³ enrichment vessel, a 3 m³ accumulation vessel and 39 accumulation batches. It supports discussion of scale-up for that feedstock and equipment, rather than showing that all wastewater can directly become an equivalent plastics feedstock.[1]
Figure 2 reconstructs the second series of 29 batches. PHA represented 7.94%–58.00% of biomass by weight, demonstrating substantial variation within the same system. These were not randomized replicate treatments, and the source provided no uncertainty for this column. The maximum is therefore not an average yield, and no significance symbols should be invented. Biomass concentration and recovered mass are also needed to interpret actual output.[1]
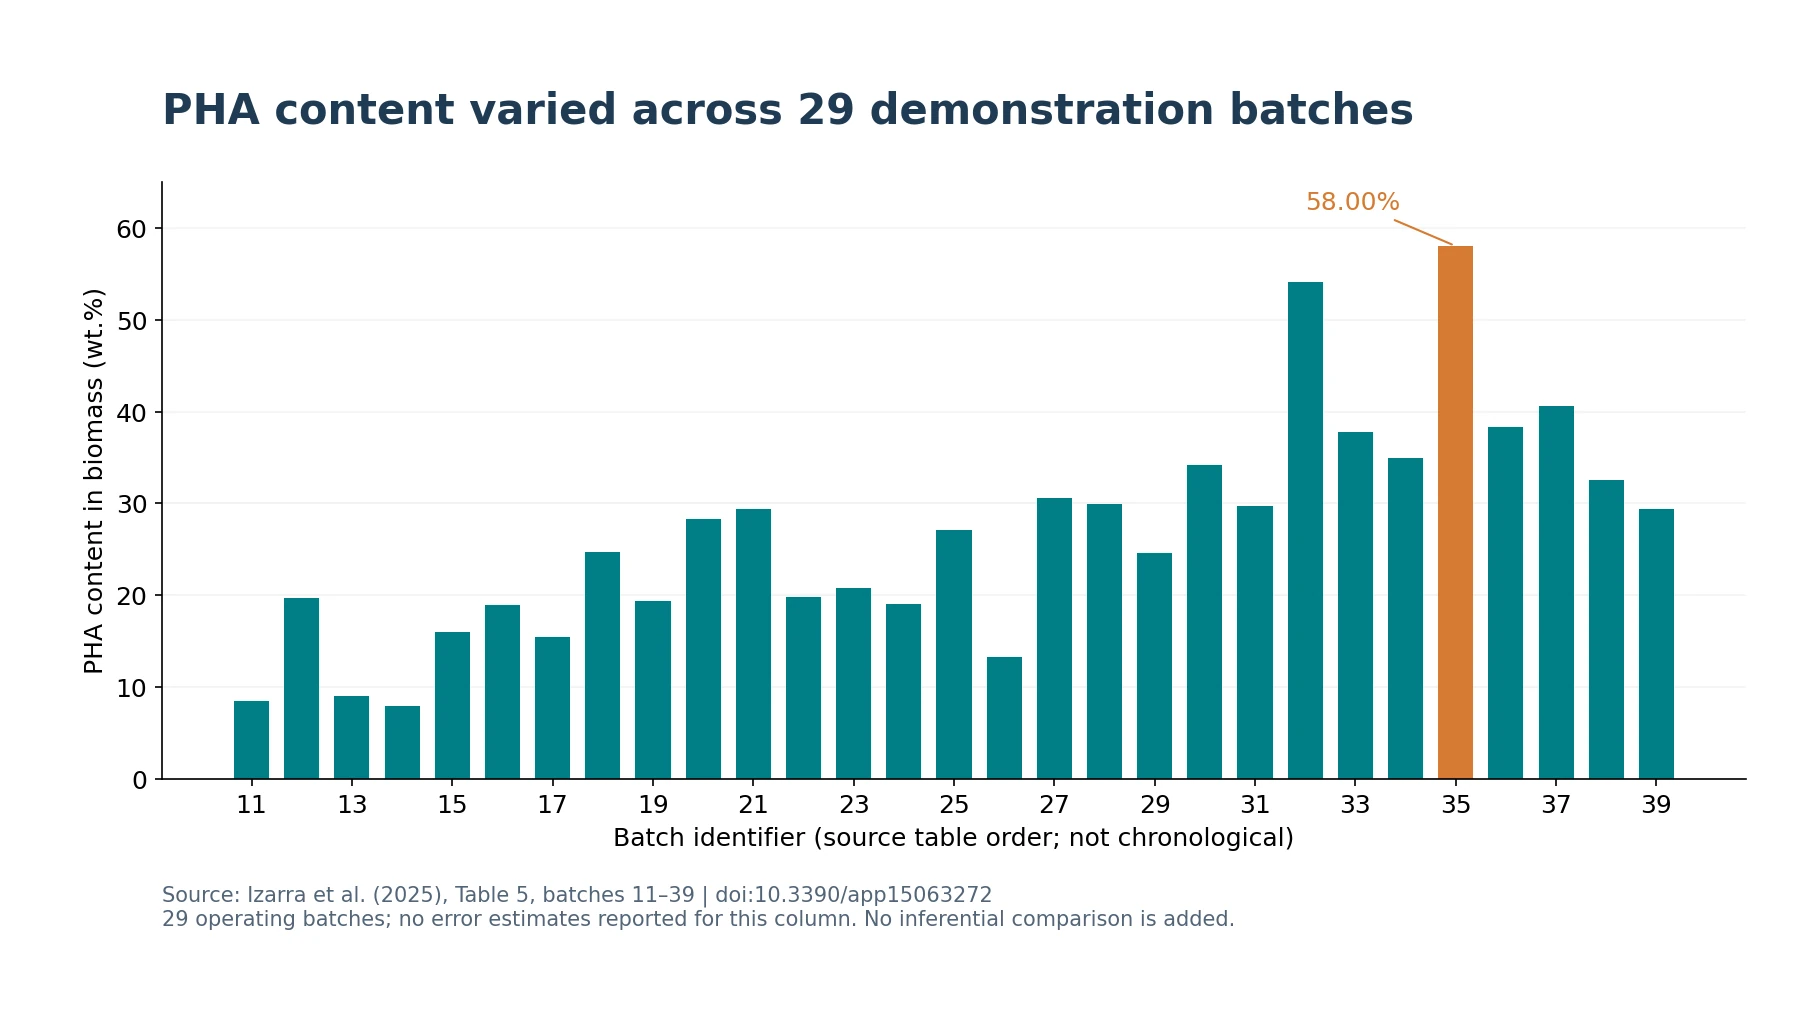
PHA content, conversion of feedstock carbon into product, extraction recovery and product purity have different denominators. Using any one percentage as an overall plant efficiency can overstate recovery. A production assessment should include feed preparation, aeration, separation, solvent recovery, testing and residue management, while confirming that the recovered material has a defined use and acceptance specification.
Less odor does not automatically mean fewer greenhouse gases
Biofilters transfer gaseous pollutants into moist media where microorganisms participate in transformation. In a compost-exhaust study, Shang and colleagues measured ammonia alongside greenhouse gases. Across the tested empty-bed residence times, 4.6%–5.6% of incoming ammonia nitrogen was converted into nitrous oxide nitrogen. Although this proportion is specific to the experiment, it demonstrates why ammonia removal cannot be equated with conversion into environmentally harmless nitrogen products.[2]
Assess odor systems using gas concentrations and airflow together, with records of media condition, moisture, pressure drop and maintenance. Perceived improvement alone does not quantify pollutant loads or avoided emissions. Better gas collection can also reduce boundary odors; its contribution should be distinguished from biological conversion inside the reactor. The operational question is where the material ultimately goes, rather than simply which measurement decreases.
| Application | Measurements | Common misinterpretation |
|---|---|---|
| Wastewater | Concentration × flow; sludge and off-gas destinations | Dilution mistaken for removal |
| Odor control | Inlet/outlet loads, pressure drop and by-products | Ammonia removal mistaken for carbon savings[2] |
| Recovery | Accepted product mass, purity and system boundary | Cellular PHA content mistaken for plant carbon recovery[1] |
Recovered resources must also meet material-quality requirements
Lorini and colleagues characterized PHA from pilot plants using different organic wastes, examining polymer composition, molecular weight and thermal properties. Producing PHA is therefore only a starting point: downstream suitability depends on the material itself. Results from one waste source cannot automatically be transferred to another process, and pilot findings do not constitute complete commercial validation.[3]
Likewise, phosphorus-rich sludge, digestate or fermentation liquid needs compositional, impurity, stability and end-use assessment before being treated as a recovered resource. A decrease in the water phase may merely indicate transfer into solids. If those solids still require paid disposal, the entire removal cannot be booked as recovery income. Recovery performance should refer to delivered, specification-compliant material or demonstrably displaced inputs.
What evidence supports a scale-up decision?
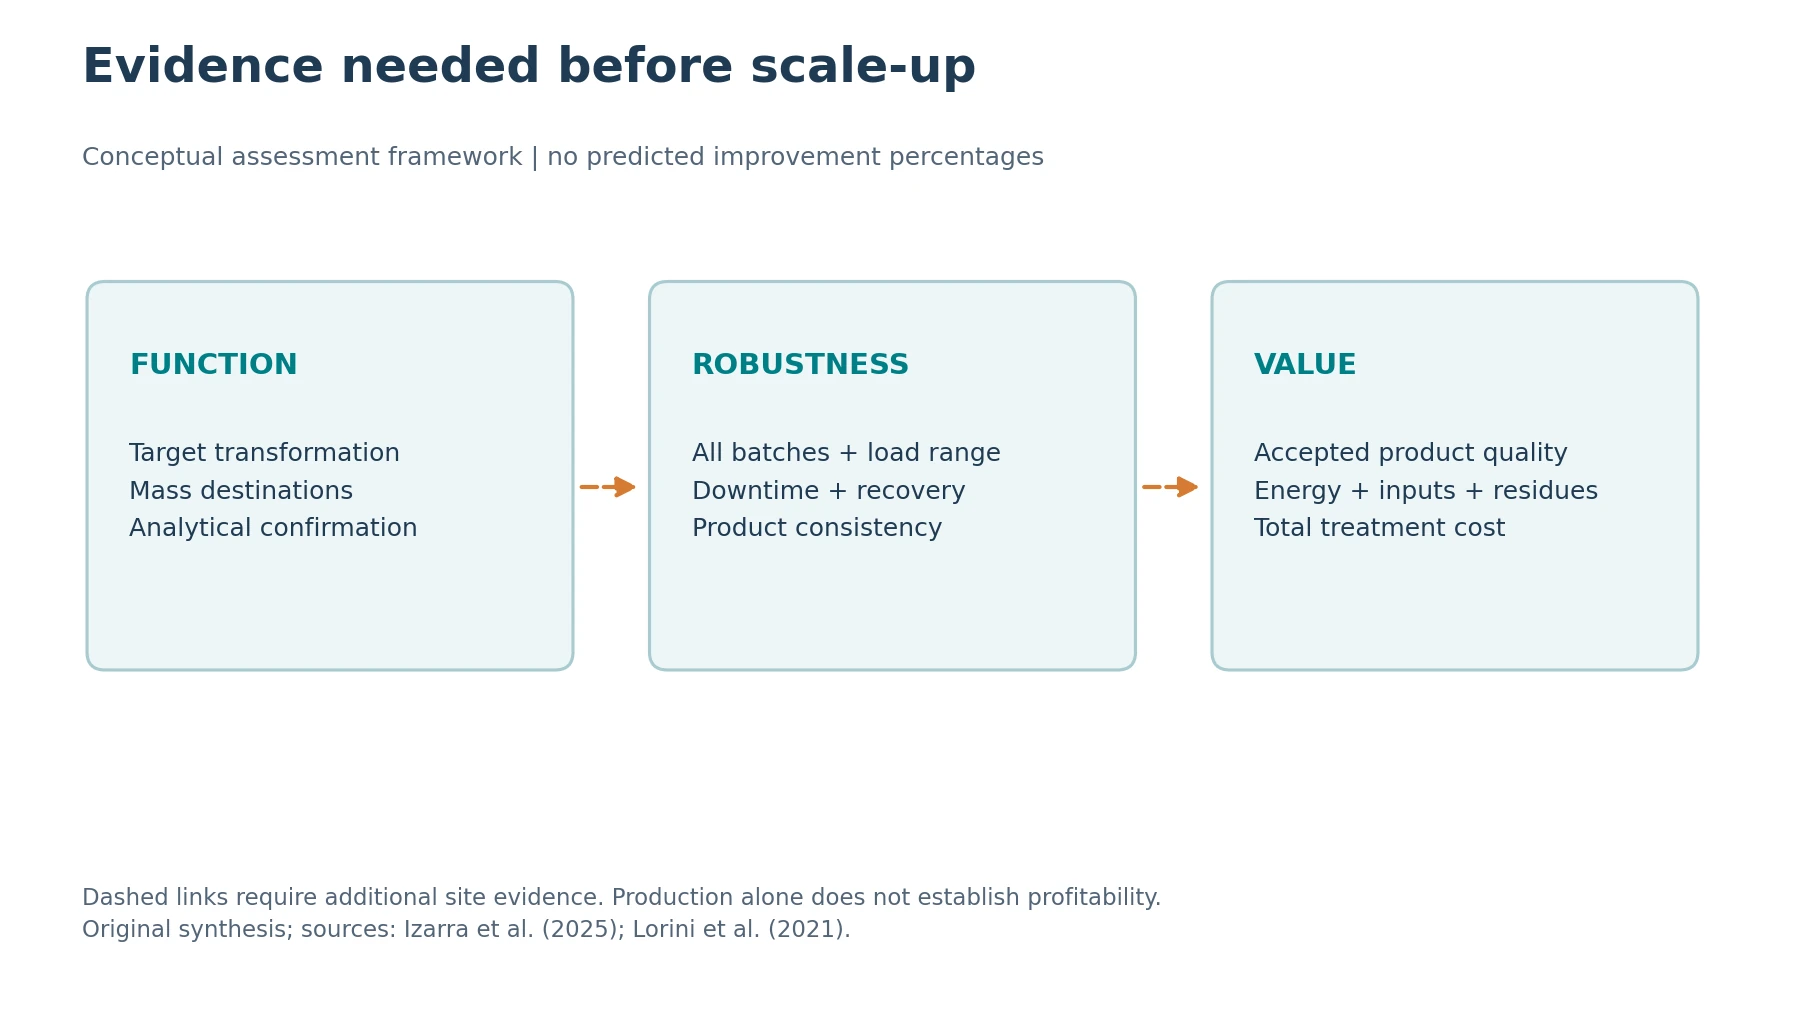
Establish a baseline, compare performance under similar loads and examine variability and recovery after disturbances. Include influent and effluent or gas loads, energy, chemicals, sludge and maintenance. Selecting only low-load days or the best-performing batches conceals failures and downtime costs that matter to production.
Community profiles and functional genes can help explain changes, but they should be compared with contemporaneous chemical measurements and outputs. Higher relative abundance does not establish greater absolute abundance or completed pollutant conversion. More useful records specify sampling location, timing, units and analytical methods so that variation across dates and sites can be interpreted.
| Stage | Required records | Decision supported |
|---|---|---|
| Functional feasibility | Feedstock, analytical methods and material destinations | Establish target conversion |
| Demonstration | All batches, loads, downtime and recovery | Define the operating envelope |
| Scale-up assessment | Specifications, costs, material and energy balances | Evaluate further investment |
Frequently asked questions
- Does adding more microorganisms necessarily improve treatment?
No. Loading, toxicity, mass transfer and equipment constraints may matter more than inoculum counts. Compare outcomes under equivalent management rather than ranking products solely by the number of species or cells.
- Can an industrial microbial process directly claim carbon savings?
That requires a separate assessment. Odor reduction, lower COD and recovered resources each have value. A quantified carbon claim also needs energy and material boundaries, direct emissions and a substitution scenario. Traceable operating records connecting transformation, product quality and cost provide a basis for scale-up decisions.
References
[1] Izarra I, Álvarez I, Pinar FJ, Mena J (2025). Urban Biorefinery Demonstration: Production of Polyhydroxyalkanoates from a Municipal Solid Waste. Applied Sciences 15(6): 3272. doi:10.3390/app15063272
[2] Shang B, Zhou T, Tao X, Chen Y (2022). Greenhouse Gas Emissions From Biofilters for Composting Exhaust Ammonia Removal. Frontiers in Bioengineering and Biotechnology 10: 918365. doi:10.3389/fbioe.2022.918365
[3] Lorini L, Martinelli A, Capuani G et al. (2021). Characterization of Polyhydroxyalkanoates Produced at Pilot Scale From Different Organic Wastes. Frontiers in Bioengineering and Biotechnology 9: 628719. doi:10.3389/fbioe.2021.628719
Scientific information and validation planning; not evidence of efficacy for a particular company product or site.