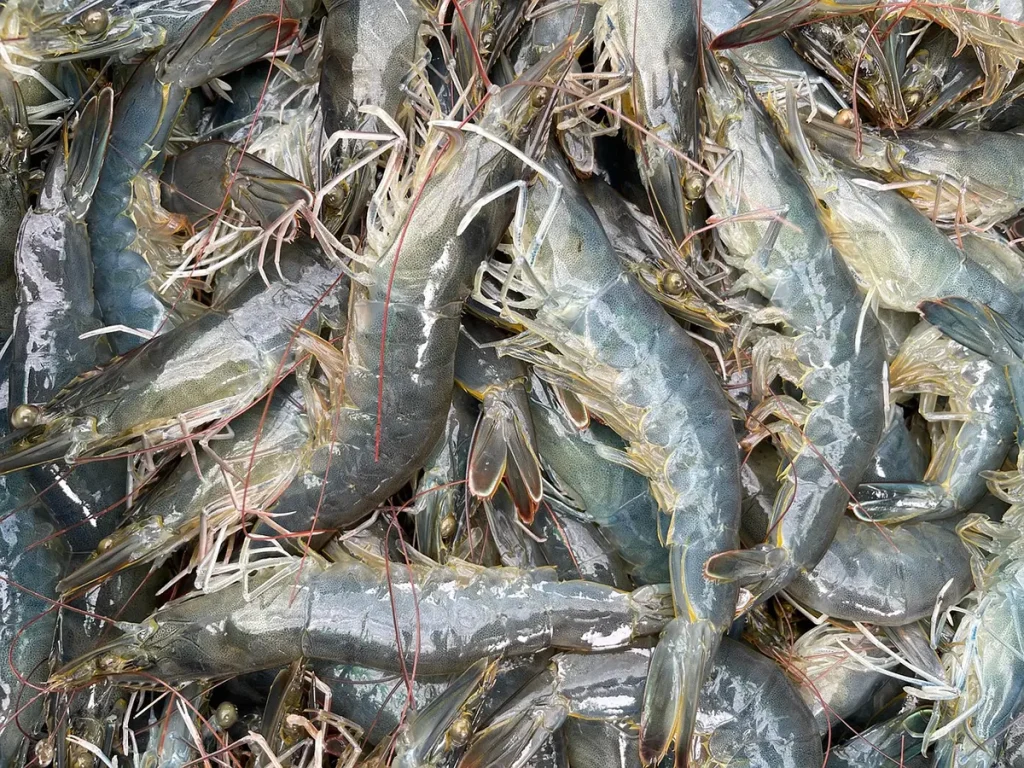
Slow growth in Pacific white shrimp does not automatically indicate calcium deficiency. In low-salinity groundwater or artificial salt mixtures, apparently adequate salinity and total hardness can coexist with low potassium or an unsuitable calcium–magnesium profile. These ions support osmoregulation, metabolism and molt-related physiology, while growth also depends on feeding, oxygen, temperature and health. The useful starting point is to identify the water source and ionic composition, then relate changes to growth, survival and feed efficiency in the same shrimp population.[3, 5, 6]
Hardness, alkalinity and salinity answer different questions
Total hardness is usually expressed as mg/L as CaCO₃ and is largely attributable to dissolved calcium and magnesium. It does not describe the amount of calcium carbonate powder physically present. Alkalinity measures acid-neutralizing capacity, often supplied by bicarbonate and carbonate. The two measurements can share units while describing different properties. Salinity reflects the overall salt content and does not replace individual measurements of calcium, magnesium, potassium, sodium and chloride.[1, 2]
| Measure | Units and meaning | Does not establish |
|---|---|---|
| Total hardness | mg/L as CaCO₃; mainly Ca and Mg | Potassium sufficiency or a complete ionic profile |
| Total alkalinity | mg/L as CaCO₃; acid-neutralizing capacity | Individual Ca and Mg concentrations |
| Salinity | g/L and other conventions; overall salts | A seawater-like ionic composition |
| Individual ions | Elemental mg/L; Ca, Mg, K, Na, Cl, etc. | Targets without matching salinity and culture stage |
When calcium and magnesium dominate hardness, the conversion can be understood as total hardness ≈ 2.497 × Ca + 4.118 × Mg, with elemental Ca and Mg in mg/L. Potassium is absent from this equation. Two waters measuring 300 mg/L as CaCO₃ can therefore have very different calcium and magnesium contributions and entirely different potassium concentrations. This is a chemical calculation example, not a recommended culture-water target.[1]
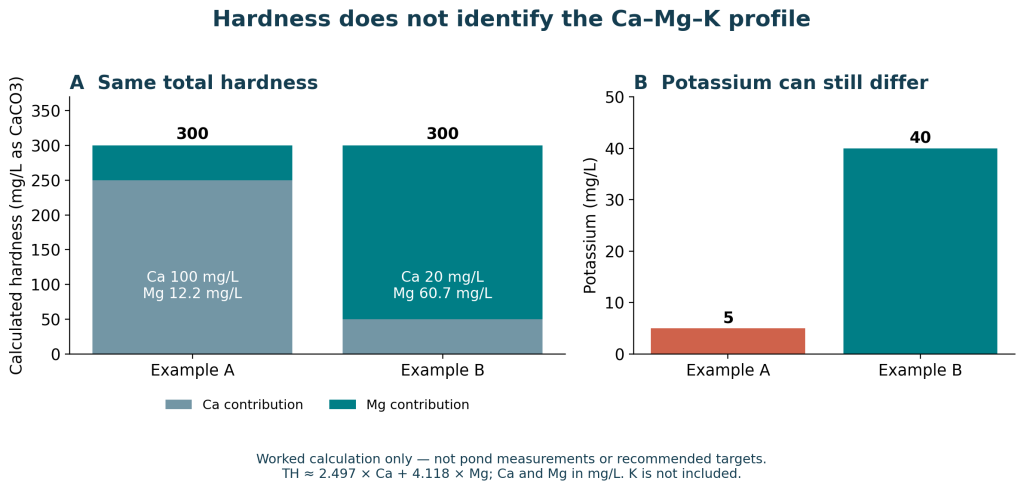
Figure 1|Equal hardness does not establish equal ionic composition
Calculated examples, not pond observations, an animal trial or targets. Calcium is 100 and 20 mg/L in A/B; magnesium is calculated at about 12.2 and 60.7 mg/L. Potassium is separately set at 5 and 40 mg/L and contributes no hardness. Sample size and statistics do not apply. Original drawing; factors use CaCO3, Ca and Mg equivalents for Ca/Mg-dominated hardness. [1]
How calcium, magnesium and potassium relate to growth
Calcium is relevant to exoskeletal mineralization and changes around molting, but supply from water and feed needs separate consideration. Cheng et al. found that dietary calcium, phosphorus and their interaction affected growth and tissue mineral composition in low-salinity water. More calcium is therefore not a universal answer independent of the diet. Soft shells, poor post-molt recovery or slow growth cannot by themselves diagnose calcium deficiency.[8]
Potassium is relevant to cellular ion gradients and neuromuscular function, while branchial Na⁺/K⁺-ATPase uses ATP to support ion regulation. Magnesium participates in many ATP-dependent enzymatic and metabolic reactions. An unsuitable ionic environment can change the burden of maintaining internal conditions. However, greater enzyme activity does not necessarily mean better growth: physiological measurements and production outcomes need to be interpreted together.[3, 4]
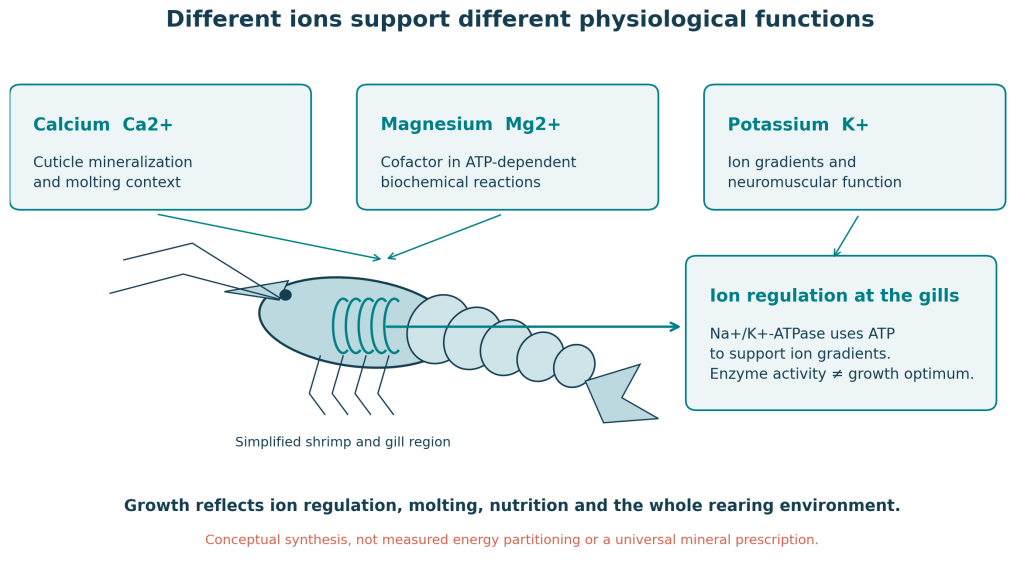
Figure 2|Different ions support different physiological functions
Original conceptual synthesis, not a BioRender output, anatomical section or measurement of energy partitioning. Gill placement is schematic; arrows represent functional relationships, not proof that adjusting one ion accelerates growth. Enzyme activity and growth can peak in different treatments. Sample size, error bars and statistical tests do not apply. [3, 4, 8]
Why high hardness can coexist with an ionic problem
Groundwater chemistry reflects the geological material it contacts and need not resemble diluted seawater. In calcium-rich groundwater from Kuwait, Al-Subiai et al. studied Mg/Ca adjustment even though absolute magnesium already exceeded the concentration in diluted seawater of matching salinity. With three tanks per treatment, the study included four-week nursery and eight-week grow-out trials. Magnesium supplementation improved nursery survival and growth, while the grow-out response primarily involved growth.[5]
The study supports checking both concentrations and ratios; it does not establish one Mg/Ca value for every pond. A ratio must state its direction and calculation basis: a mass ratio calculated from mg/L differs from a molar ratio calculated from mmol/L. The same ratio can also occur at very low or high total concentrations. Ignoring absolute levels, other ions or the production stage can therefore lead to the wrong interpretation.[5]
Potassium needs to be interpreted alongside sodium
Liu et al. compared six Na/K ratios in an eight-week low-salinity well-water trial, with three replicates per treatment. The highest weight gain and lowest FCR occurred at Na/K = 23:1, the highest survival at 42:1, and the highest branchial Na⁺/K⁺-ATPase activity at 17:1. Different endpoints therefore peaked in different groups. The largest physiological measurement cannot automatically be equated with the best growth condition.[4]
Those ratios describe a particular water source and experiment, not a pond-wide potassium dosing formula. For a new source, interpret measured K together with Na, Ca, Mg, Cl and salinity, using a reference composition at matching salinity as a comparison tool. Concentrations in full-strength seawater should not be imposed directly on a low-salinity pond.[3, 4]
Why the same ionic profile can perform differently across stages
Ueno Fukura et al. compared two salinities and two multi-ion profiles. The redrawn primary table shows the highest final weight in S8IB2 during nursery and S4IB1 during grow-out; survival did not differ significantly among treatments. These are combined salinity and multi-ion treatments, so the effects cannot be assigned to calcium, magnesium or potassium alone. Starting weights and stocking densities also differed between stages; comparisons should be made within each stage.[6]
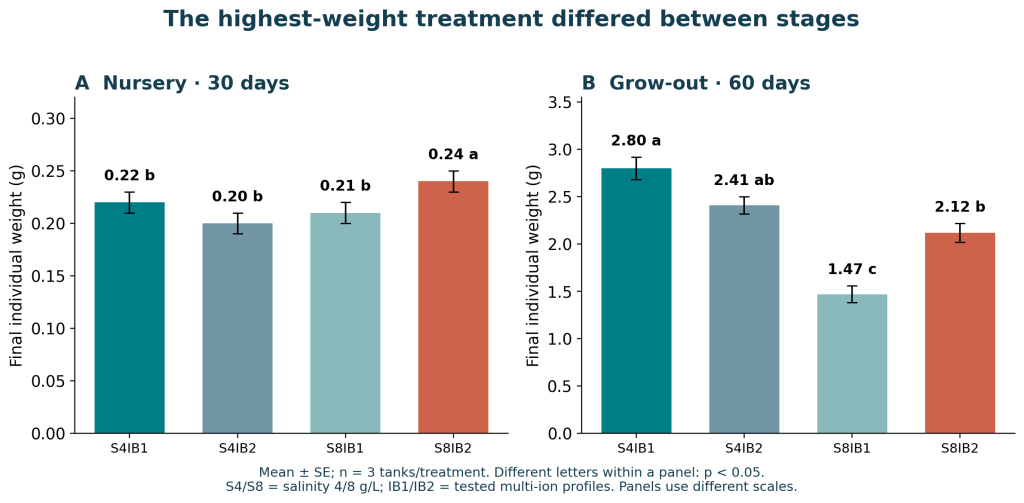
Figure 3|The highest-weight treatment changes with culture stage
Redrawn from Ueno Fukura et al. (2024), Table 4. Nursery: 30 days; grow-out: 60 days; n = 3 tanks/treatment. S4/S8: salinity 4/8 g/L. IB1/IB2: tested Na:Mg:Ca:K mass ratios 27.6:3.6:1.05:1/40.6:4.7:1.98:1. Mean ± SE; different letters within a panel indicate P < 0.05; shared letters indicate no significant difference. Scales, starting weights and densities differ. Original chart from tabulated data, not a reproduced publisher figure. [6]
In biofloc systems, microbial nitrogen conversion, oxygen demand and alkalinity requirements also belong in the interpretation. Active microbial processes do not establish ionic balance, and adding microbes does not automatically replace missing potassium or magnesium. Conversely, a growth response after mineral adjustment may involve flocs, feeding or nitrogenous compounds as well as direct mineral physiology.[6]
Can dietary minerals replace water correction?
Two seven-week feeding trials by Roy et al. provide an important qualification. Mineral treatments did not significantly alter growth or survival in the first trial. In the second, a specific potassium amino-acid complex improved growth, while magnesium and sodium-chloride treatments did not show the same response. Mineral form, leaching and availability matter. Dietary mineral inclusion therefore does not prove that a waterborne deficiency has been corrected, nor can one tested form represent every mineral product.[7]
How to investigate slow growth and ionic balance on farm
First determine whether the problem is reduced weight gain, size variation, lower survival or poorer feed conversion; these need not share one cause. Align repeated measurements of mean weight, size distribution, feed intake, molting observations and mortality with oxygen, temperature, pH, ammonia and nitrite records. Mineral adjustment should complement assessment of oxygen limitation, feeding, density and health rather than replace it.
| Observation | Read together | Decision to investigate |
|---|---|---|
| Slow growth despite high hardness | Separate Ca/Mg, plus K, Na and salinity | Whether high Ca masks another ionic difference |
| Changes after rain or water exchange | Before/after ions, alkalinity, salinity and oxygen | Dilution or source-water changes |
| Molting or soft-shell observations | Diet, ions, temperature, health and survival | Avoid diagnosing Ca deficiency from appearance alone |
| Response after correction | Growth, size distribution, survival and FCR in the same batch | Separate chemistry changes from biological responses |
When testing identifies a gap, evaluate any correction using actual water volume, product purity, elemental fraction and hydration state, then verify the resulting concentrations. Equal masses of magnesium chloride, magnesium sulfate or their different hydrates do not supply equal magnesium. Carbonates, chlorides and sulfates also introduce different accompanying ions and water-quality effects. Slow growth alone is insufficient grounds for prescribing a fixed quantity per pond.
Frequently asked questions
Does adequate total hardness remove the need to test potassium? No: potassium is not represented by total hardness. Is there a universal ideal Ca:Mg:K ratio? Research shows dependence on water source, salinity, stage and system; concentrations and ratios need joint evaluation. How quickly will mineral addition accelerate growth? A single water measurement cannot establish that outcome. Follow growth, survival and feeding over time, distinguishing immediate water chemistry from the subsequent biological response.[1, 4, 5, 6]
References
- U.S. Geological Survey (n.d.). Hardness of Water. Water Science School; accessed 2026-10-27. https://www.usgs.gov/water-science-school/science/hardness-water
- U.S. Geological Survey (n.d.). Alkalinity and Water. Water Science School; accessed 2026-10-27. https://www.usgs.gov/water-science-school/science/alkalinity-and-water
- Roy, L. A., Davis, D. A., Saoud, I. P., & Henry, R. P. (2007). Effects of varying levels of aqueous potassium and magnesium on survival, growth, and respiration of the Pacific white shrimp, Litopenaeus vannamei, reared in low salinity waters. Aquaculture 262(2–4), 461–469. https://doi.org/10.1016/j.aquaculture.2006.10.011
- Liu, H., Tan, B., Yang, J., et al. (2014). Effect of various Na/K ratios in low-salinity well water on growth performance and physiological response of Pacific white shrimp Litopenaeus vannamei. Chinese Journal of Oceanology and Limnology 32, 991–999. https://doi.org/10.1007/s00343-014-3345-6
- Al-Subiai, S. N., Jang, I. K., Bae, S. H., et al. (2025). Enhancing the performance of Litopenaeus vannamei nursery and grow-out by modifying Mg/Ca ratios in biofloc systems using low-salinity groundwater of Kuwait Desert. Aquaculture 594, 741405. https://doi.org/10.1016/j.aquaculture.2024.741405
- Ueno Fukura, M., Collazos Lasso, L. F., Vinatea Arana, L. A., & Baldisserotto, B. (2024). Salinity/ionic balance interactions on the zootechnical performance and histology of Litopenaeus vannamei and water quality in a biofloc system. Journal of the World Aquaculture Society 55(5), e13093. https://doi.org/10.1111/jwas.13093
- Roy, L. A., Davis, D. A., Saoud, I. P., & Henry, R. P. (2007). Supplementation of potassium, magnesium and sodium chloride in practical diets for the Pacific white shrimp, Litopenaeus vannamei, reared in low salinity waters. Aquaculture Nutrition 13, 104–113. https://doi.org/10.1111/j.1365-2095.2007.00460.x
- Cheng, K. M., Hu, C. Q., Liu, Y. N., Zheng, S. X., & Qi, X. J. (2006). Effects of dietary calcium, phosphorus and calcium/phosphorus ratio on the growth and tissue mineralization of Litopenaeus vannamei reared in low-salinity water. Aquaculture 251(2–4), 472–483. https://doi.org/10.1016/j.aquaculture.2005.06.022